
Research on optimization of macroscopic and microscopic characteristics of 316L stainless steel by laser cladding
-
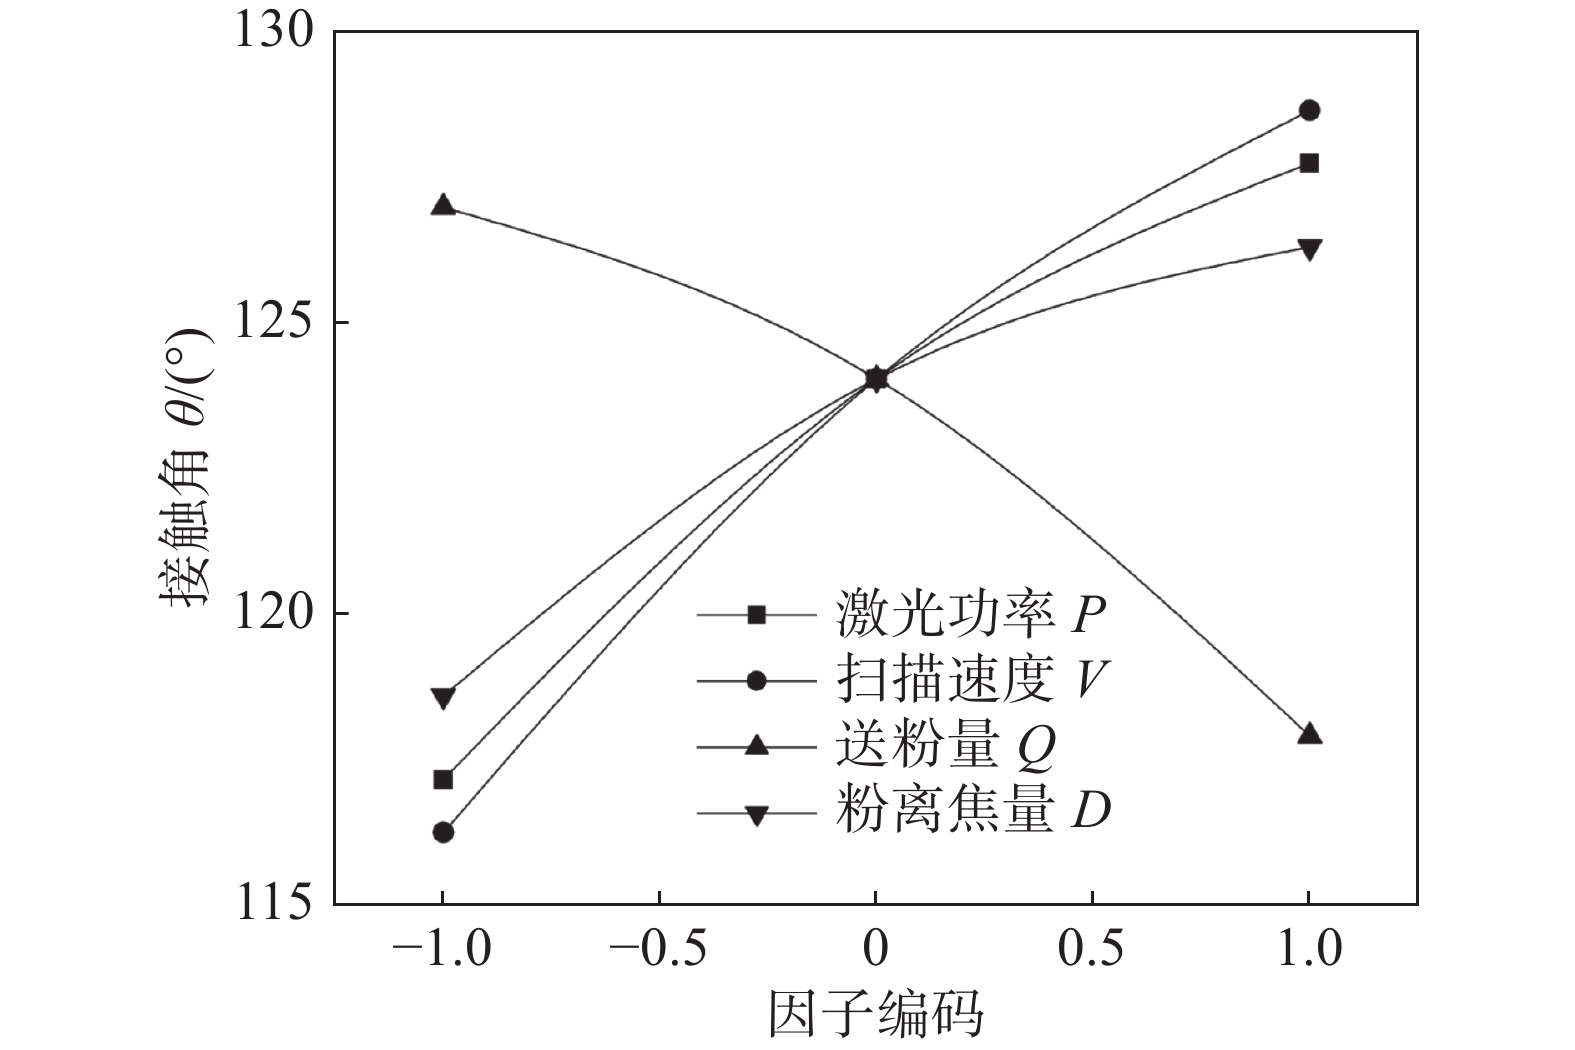
摘要: 为了获得高质量激光熔覆制件,针对现有研究仅以宏观几何形貌为优化目标的问题,以316L不锈钢为例,提出一种以宏微观特征为目标的工艺优化方法. 首先通过全析因设计和回归分析构建熔覆层宏观几何形貌及微观组织同主要工艺参数的经验统计模型,探讨了工艺参数对几何形貌及微观晶粒平均截距的影响规律. 然后选用几何形貌和晶粒平均截距作为评价熔覆成形质量的指标,采用复合合意性函数确定了最佳工艺参数和合适工艺窗口,最后验证了该方法可行性和有效性. 结果表明,在选择最佳工艺参数的条件下,宏微观特征的统计模型具有较高预测精度,制备的熔覆样件不仅具更高的显微硬度,还具备良好的拉伸性能:屈服强度为439 MPa,抗拉极限为751 MPa,断后伸长率为26%,实现了宏微观特征的优化.Abstract: In order to obtain high-quality laser cladding fabricated parts, a process optimization method targeting macroscopic and microscopic characteristics is proposed for 316L stainless steel as an example, based on the problem that existing studies only target geometric morphology for optimization.Firstly, an empirical statistical model of the geometric morphology and microstructure of the cladding layer and the main process parameters is constructed through full factorial design and regression analysis, and the influence of process parameters on the geometric morphology and the average intercept of microscopic grain is discussed. Then, the geometric morphology and the average grain intercept are selected as the indicators for evaluating the quality of cladding, and the optimal process parameters and suitable process range are determined by the composite desirability function. Finally, the feasibility and effectiveness of the method are verified. The results show that under the condition of the best process parameters, the statistical model of macroscopic and microscopic characteristics has high prediction accuracy. The prepared cladding samples not only have higher microhardness, but also have excellent tensile properties: the yield strength is 439 MPa, the tensile strength is 751 MPa, and the elongation is 26%. The process optimization of macroscopic and microscopic characteristics is achieved.
-
Keywords:
- laser cladding /
- geometric morphology /
- microstructure /
- process optimization
-
0. 序言
韧性作为评估钢材性能好坏的关键性能之一,直接影响钢铁材料设备的安全可靠使用. 大多数具有优异韧性的压力设备用钢材在经历焊接热循环后会产生一个韧性差的局部脆性区,焊件的热影响区常常是设备损坏的薄弱区[1-2] . 而解理裂纹最容易在这个区域起裂,并发生失稳扩展,进而导致断裂[3]. 研究发现[4-7],热影响区(heat affected zone,HAZ)中的粗晶热影响区(coarse grained heat affected zone,CGHAZ)会生成粗大的脆性组织. 在这个区域原始奥氏体晶粒会显著粗化,由于显微组织的粗化和基体上M-A组元析出,使得CGHAZ冲击韧性相对于母材严重下降[8-9]. 通常认为CGHAZ是HAZ中典型的最薄弱区域. 但是最薄弱区域对冲击韧性影响的详细机制尚不清楚. 文章通过实际施焊确定了HAZ的最薄弱区域, 分析了09MnNiDR埋弧焊焊接接头HAZ的组织、硬度、断口形貌以及最薄弱区域与冲击韧性之间的关系.
1. 试验方法
试验所用母材为09MnNiDR压力容器低温钢,板厚60 mm,采用埋弧焊,加工U形坡口,焊前预热温度为150 ℃,焊后经610 ℃ × 3 h退火处理. 具体的焊接工艺参数:热输入E = 20 kJ/cm,焊接电流I = 510 ~ 520 A,焊接电压U = 30 V,焊接速度v = 28 m/h. 焊接接头热影响区宏观形貌如图1所示. 采用的焊材为H09MnNiDR焊丝和SJ208DR焊剂. 母材化学成分如表1所示.
表 1 09MnNiDR钢化学成分(质量分数,%)Table 1. Chemical composition of 09MnNiDR steelC Si Mn Al Ni Nb 0.08 0.35 1.47 0.02 0.55 0.02 在板厚1/4处取冲击试样,缺口方向垂直于焊接方向(图2). 冲击试样的夏比V形缺口分别取在母材(base metal, BM),焊缝(weld metal, WM)以及热影响区各个不同的区域,CGHAZ缺口开在熔合线处,细晶热影响区(fine grained heat affected zone, FGHAZ)缺口开在距离熔合线1 mm处,临界热影响区(intercritical heat affected zone,ICHAZ)缺口开在距离熔合线1.5 mm处,亚临界热影响区(subcritical heat affected zone,SCHAZ) 缺口开在距离熔合线2 mm处. 通过带有千分尺的光学显微镜在左右移动距离为0.1 mm的范围内统计出缺口尖端粗晶热影响区宽度所占8 mm缺口尖端前沿的比例(图2c). 采用微机控制摆锤冲击试验机进行−70 ℃的低温冲击试验,Quanta450FEG型扫描电子显微镜(SEM)分析组织、断口形貌. 通过HAT-1000A数字显示显微硬度仪测量显微硬度.
![]() 图 2 冲击试样取样位置与粗晶热影响区宽度测量示意图Figure 2. Schematic diagram of sampling position and measuring width of CGHAZ of impact specimen. (a) sampling position of impact specimen; (b) weld cross section; (c) statistical analysis the width of CGHAZ
图 2 冲击试样取样位置与粗晶热影响区宽度测量示意图Figure 2. Schematic diagram of sampling position and measuring width of CGHAZ of impact specimen. (a) sampling position of impact specimen; (b) weld cross section; (c) statistical analysis the width of CGHAZ2. 试验结果
2.1 焊接接头各区域的冲击吸收能量
焊接接头−70 ℃平均冲击吸收能量如表2所示. BM,SCHAZ,ICHAZ,FGHAZ的冲击吸收能量都在270 J以上,而FGHAZ表现出最高的冲击吸收能量,WM的冲击韧性表现良好,冲击吸收能量平均达到139 J. 焊接接头各区域的断口形貌如图3所示. BM,SCHAZ,ICHAZ,FGHAZ都是以大量韧窝和撕裂脊组成的韧性断裂. WM的断口上呈现解理面与韧性撕裂脊共存的现象,表现为准解理断裂. 通过将缺口开在熔合线处,得到含有不同比例CGHAZ的焊接接头试样,大量试验发现这些试样冲击吸收能量在20 ~ 320 J的范围内,在这个区域冲击吸收能量出现巨大的波动,断口形态也有显著差异,将在2.3节中单独讨论.
表 2 焊接接头−70 ℃下各区域的冲击吸收能量(J)Table 2. Impact energy of each region for 09MnNiDR welded joints at −70 ℃BM SCHAZ ICHAZ FGHAZ CGHAZ WM 276 281 274 304 20 ~ 320 139 ![]() 图 3 焊接接头冲击断口形貌Figure 3. Impact fracture surfaces of in various regions of the welded joint. (a) BM; (b) SCHAZ; (c) ICHAZ; (d) FGHAZ; (e) WM
图 3 焊接接头冲击断口形貌Figure 3. Impact fracture surfaces of in various regions of the welded joint. (a) BM; (b) SCHAZ; (c) ICHAZ; (d) FGHAZ; (e) WM2.2 焊接接头各区域的微观组织及硬度
焊接接头不同区域的组织如图4所示. 09MnNiDR母材组织为铁素体,且基体上弥散分布有少许碳化物,SCHAZ, ICHAZ, FGHAZ组织均为块状铁素体. 不同的是,ICHAZ组织为尺寸不均匀的块状铁素体,这可能是一部分没有发生奥氏体化的铁素体在冷却的过程中继续长大,从而ICHAZ的组织由晶粒尺寸差异较大的铁素体组成. FGHAZ为晶粒尺寸均匀且细小的块状铁素体组成. WM的一次组织为粗大的柱状晶,分布有少量碳化物,在晶界内形成细小的针状铁素体,二次组织为块状铁素体,且尺寸较为均匀. CGHAZ组织发生严重的粗化,在冷却的过程中,产生粗大的复合组织 (粒状贝氏体 + 板条贝氏体 ).
![]() 图 4 焊接接头各区域的显微组织Figure 4. Microstructures in various regions of the welded joint. (a) BM; (b) SCHAZ; (c) ICHAZ; (d) FGHAZ; (e) CGHAZ; (f) WM
图 4 焊接接头各区域的显微组织Figure 4. Microstructures in various regions of the welded joint. (a) BM; (b) SCHAZ; (c) ICHAZ; (d) FGHAZ; (e) CGHAZ; (f) WM通过比较晶粒尺寸差异较大的BM,FGHAZ和CGHAZ(图5),发现BM的平均晶粒尺寸为15.7 µm,最大为38 µm;FGHAZ的平均晶粒尺寸为11.8 µm,最大为24 µm;而CGHAZ的平均晶粒尺寸为29.5 µm,最大为63 µm. CGHAZ晶粒尺寸粗化显著. 焊接接头各区域的显微维氏硬度如图6所示,SCHAZ硬度相比于母材发生少许软化,平均在155 ~ 166 HV,其它区域并未产生软化现象,而临近熔合线的CGHAZ的复合组织表现出最高的硬度值,平均为207 ~ 226 HV.
![]() 图 5 焊接接头晶粒尺寸分布图Figure 5. Distribution of grain size of the welded joint. (a) BM; (b) FGHAZ; (c) CGHAZ
图 5 焊接接头晶粒尺寸分布图Figure 5. Distribution of grain size of the welded joint. (a) BM; (b) FGHAZ; (c) CGHAZ2.3 粗晶热影响区宽度占缺口尖端前沿比例与冲击吸收能量的关系
图7为缺口尖端开在熔合线处不同冲击吸收能量下的冲击试样的宏观和微观断口形貌,缺口尖端前沿的组织比例具有随机性,使得这些试样的冲击吸收能量波动巨大. 当冲击吸收能量为20 J时,测得粗晶区宽度所占比例达到整个缺口尖端前沿的96.5%,断口呈现完全的解理断裂. 随着缺口尖端前沿CGHAZ宽度逐渐减小,冲击吸收能量提高. 由于CGHAZ区域为完全脆性解理断裂特征,从图3可知焊接接头热影响区域中的其它区域的断口特征均为韧窝断裂形态,所以直接可以通过断口上脆性解理断裂的区域来测量缺口尖端前沿粗晶热影响区宽度分布的比例. 根据测量结果统计了图8所示缺口尖端前沿粗晶热影响区的分布比例与冲击吸收能量之间的关系,发现当缺口前沿无粗晶热影响区时,冲击吸收能量达到260 J以上,试样断裂形式为完全的韧性断裂,断口完全被韧性断裂区所覆盖. 粗晶热影响区占8 mm缺口尖端前沿的比例达到25%左右时,冲击吸收能量降低到202 J. 当比例达到70% ~ 80%时,冲击吸收能量分别下降到60,48,30 J左右,相比母材冲击韧性损失达到了80% ~ 90%. 总体趋势为:随着缺口尖端前沿粗晶热影响区占8 mm区域的比例的增加,冲击吸收能量逐渐降低.
![]() 图 7 缺口前沿占有不同比例粗晶热影响区的冲击试样断口的宏观和微观形貌Figure 7. Macroscopic and microscopic fracture surfaces of impact specimens with different CGHAZ factions. (a) macroscopic fracture-20 J; (b) microscopic fracture-20 J; (c) macroscopic fracture-60 J; (d) macroscopic fracture-60 J; (e) microscopic fracture-141 J; (f) macroscopic fracture-141 J; (g) macroscopic fracture-202 J; (h) microscopic fracture-202 J
图 7 缺口前沿占有不同比例粗晶热影响区的冲击试样断口的宏观和微观形貌Figure 7. Macroscopic and microscopic fracture surfaces of impact specimens with different CGHAZ factions. (a) macroscopic fracture-20 J; (b) microscopic fracture-20 J; (c) macroscopic fracture-60 J; (d) macroscopic fracture-60 J; (e) microscopic fracture-141 J; (f) macroscopic fracture-141 J; (g) macroscopic fracture-202 J; (h) microscopic fracture-202 J![]() 图 8 缺口尖端前沿粗晶热影响区所占比例与冲击吸收能量的关系Figure 8. Relationship between fraction of CGHAZ in front of the notch tip and impact absorbed energy
图 8 缺口尖端前沿粗晶热影响区所占比例与冲击吸收能量的关系Figure 8. Relationship between fraction of CGHAZ in front of the notch tip and impact absorbed energy2.4 临界事件
Chen等人[10]提出解理断裂的3个准则,分别为裂纹形核控制的应变准则,控制裂纹钝化的三向应力度准则以及控制裂纹扩展的应力准则. 而临界事件被定义为这3个准则当中最困难的阶段,这个阶段控制解理断裂微观开裂过程. 对于起裂但终止扩展而残留在断裂试样上的微裂纹进行观察,以确定解理断裂的裂纹扩展过程中最艰难的阶段-临界事件. 并且残留裂纹通常在具有最大阻力的晶粒边界或者第二相被中断,只有完全解理的断口侧面的残留裂纹才能更准确的反应临界事件. 故可以观察残留裂纹的扩展路径去推断试样断裂过程中最难发生的阶段. 图9所示为CGHAZ比例占96.5%、最低冲击吸收能量为20 J的冲击试样断口侧面的残留裂纹.从图9可知残留裂纹有三种形态,一是穿过晶界,沿着晶界扩展;二是穿过晶粒边界,裂纹发生偏转,最终停留在晶粒内;三是直接停留在一个晶界上.以上形态也说明对于铁素体钢缺口试样,粗晶热影响区组织的晶粒边界对裂纹的扩展具有关键性的阻碍作用. 为了进一步推断临界事件,对完全解理的冲击试样断口上的解理小面半长轴进行测量如图7b所示,发现解理小面半长轴ac大约在26 ~ 35 µm左右,与最大晶粒尺寸的1/2 (31.5 µm)能较好的吻合,可以推论在铁素体钢缺口试样中解理断裂的临界事件是晶粒尺寸的裂纹穿过晶粒/晶粒边界的扩展,粗大晶粒为关键的微观组元,最粗大晶粒的尺寸表征了临界事件的尺寸.
![]() 图 9 冲击试样断口侧面残留裂纹Figure 9. Retained cracks on the side surface in fracture surface of the impact specimen. (a) cracks’ propagation along grain boundaries; (b) cracks’ deflection; (c) cracks’ stopping propagation on the grain boundary
图 9 冲击试样断口侧面残留裂纹Figure 9. Retained cracks on the side surface in fracture surface of the impact specimen. (a) cracks’ propagation along grain boundaries; (b) cracks’ deflection; (c) cracks’ stopping propagation on the grain boundary3. 分析与讨论
3.1 焊接接头最薄弱区域的确定
试验中CGHAZ和FGHAZ最大亚晶粒尺寸分别为63和24 μm. CGHAZ亚晶粒尺寸显著增大,FGHAZ的铁素体晶粒分布均匀且细小,平均尺寸为11.8 μm. FGHAZ的平均晶粒尺寸仅为CGHAZ的1/3,FGHAZ微观组织具有更好的韧性. 因此,韧性的提高是由细小的晶粒引起的,而对于CGHAZ,由于硬度较高的粒状贝氏体和板条贝氏体组织的出现,使得硬度值平均达到了207 ~ 226 HV,大于焊接接头任何区域的硬度. 由于晶粒尺寸的粗化以及出现的复合组织表现出最差的韧性[11-13]. 因此,细小的块状铁素体表现出最优的冲击韧性,而CGHAZ中粗大的粒状贝氏体和铁素体组成的复合组织表现出最差的冲击韧性. 从显微组织确定CGHAZ是焊接接头的最薄弱区域. Chen等人[10]提出临界事件决定了解理微观开裂的过程中最薄弱的区域,对于解理微观开裂过程,裂纹起裂和扩展产生于最薄弱的组元(最薄弱的区域,即粗大的晶粒)中,而不是产生于最小晶粒的最强组织组元中,最大的晶粒提供最低的阻力,而最小的晶粒则提供最大的阻力,这意味着尽管形成临界事件的临界阶段为整体开裂过程提供了更大的困难,但是微观开裂仍然发生在临界开裂阶段中最低阻力的最薄弱区域(微观组元)上. 文中缺口试样中解理断裂的临界事件是晶粒尺寸的裂纹穿过晶粒/晶粒边界的扩展,即最困难的阶段. 而粗大的复合组织只在CGHAZ发现,其它亚区域并不存在. CGHAZ中由复合组织组成的粗大晶粒为关键的微观组元(薄弱组元),最粗大晶粒的尺寸称为临界事件的尺寸. 因而确定了临界事件,也就认定了裂纹扩展的最困难阶段以及最弱的阻力来自于哪个微观组元,从而也就确定了试样的最薄弱区域. 图7a中所示为CGHAZ比例占96.5%、最低冲击吸收能量为20 J的冲击试样其断裂为完全的解理断裂形态,这也进一步说明09MnNiDR中CGHAZ是最薄弱的区域.
3.2 粗晶热影响区比例对冲击韧性的影响
取样位置的微小变化会造成冲击韧性的显著差异,随着缺口尖端前沿的CGHAZ宽度所占比例增加,冲击吸收能量逐渐降低,直至达到20 J. 表明缺口尖端的微观组织所占比例对冲击韧性有很大的影响,冲击吸收能量从260 J左右变化到20 J,断裂模式从韧性断裂变为解理断裂,其中最主要原因是在缺口尖端前沿8 mm区域上存在一定比例的CGHAZ. 这表明除了由粗大的粒状贝氏体,板条贝氏体和块状铁素体组织组成的CGHAZ外,其它区域的组织在试验温度下表现出更好的韧性. 而起裂源处的解理小面半长轴尺寸和CGHAZ最大晶粒尺寸的1/2相一致,表明CGHAZ中粗大晶粒是起裂位置. 因此随着CGHAZ比例的增加,冲击韧性逐渐降低. 在实际焊接条件下,虽然无法获得完整CGHAZ的冲击韧性. 但是,根据图8中CGHAZ分布比例与冲击韧性的关系,可以通过多项式拟合获得CGHAZ完整的冲击韧性.
综上所述,焊接接头的冲击韧性的差异主要来自缺口尖端前沿CGHAZ的比例. 而晶粒尺寸以及微观组织决定了CGHAZ的强韧性. 因此CGHAZ在缺口尖端前沿的分布也就影响着试样整个焊接接头的冲击韧性. 文中揭示了09MnNiDR焊接接头最薄弱区域以及最薄弱区域与冲击韧性之间的关系,对实际焊接热影响区冲击韧性的评估建立了一定的理论根据.
4. 结论
(1) 揭示了09MnNiDR低温钢焊接接头在实际施焊热输入为20 kJ/cm的情况下,最薄弱区域为CGHAZ,CGHAZ粗大的复合组织 (粒状贝氏体 + 板条贝氏体 ) 使得冲击吸收能量最低在20 J左右,相对于母材冲击吸收能量降低约92.7%,粗大晶粒的出现以及复合组织的转变是韧性恶化的重要因素.
(2) 随着缺口尖端前沿粗晶热影响区的比例越大,冲击韧性越低. CGHAZ比例达到70% ~ 80% 时冲击吸收能量分别降低到60,48,30 J,相比母材韧性损失达到80% ~ 90%,充分体现出薄弱环节对接头冲击韧性的损害有巨大的影响.
-
![]()
图 1 熔覆截面宏观几何形貌示意图
Figure 1. Schematic diagram of macro geometric morphology of cladding section
![]()
图 3 激光熔覆加工设备
Figure 3. Laser cladding processing device. (a) laser cladding processing system; (b) spindle
![]()
图 4 拉伸试样示意图(mm)
Figure 4. Schematic diagram of tensile specimen. (a) specimen preparation; (b) sample size; (c) tensile specimen
![]()
图 11 优化组熔覆层微观组织结构
Figure 11. Microstructure of cladding layer for optimization. (a) cladding layer of optimization group; (b) bottom region; (c) central region; (d) right region
![]()
图 12 试验组19熔覆层微观组织结构
Figure 12. Microstructure of cladding layer for experimental No.19. (a) cladding layer of No.19 experiment; (b) left region; (c) bottom region; (d) right region
![]()
图 15 多层多道试样的横截面
Figure 15. Cross-section of multi-layer specimen. (a) cross section of the sample; (b) partial enlarged view of the section
表 1 工艺参数及其因子水平
Table 1 Process parameters and factor levels
水平 激光功率P/W 扫描速度v/(mm·min−1) 送粉量Q/(g·min−1) 粉末离焦量D/mm 1 1 400 700 15.5 1.5 0 1 200 600 14 1.0 −1 1 000 500 12.5 0.5  下载: 导出CSV
表 2 因子水平及响应结果
Table 2 Factor levels and response results
运行序 工艺参数 响应值 激光功率P /W 扫描速度V /(mm·min−1) 送粉量Q /(g·min−1) 粉离焦量D /mm 宽高比λ 接触角θ /(°) 稀释率κ 晶粒平均截距l/μm 1 1 000 500 15.5 0.5 2.443 101.598 0.059 7.438 2 1 200 600 14.0 1.0 3.680 122.952 0.193 4.918 3 1 000 500 12.5 1.5 3.703 123.256 0.141 4.000 4 1 400 500 12.5 1.5 4.187 128.930 0.353 5.806 5 1 400 500 15.5 1.5 3.651 122.569 0.250 6.923 6 1 400 700 12.5 0.5 4.912 134.687 0.349 5.085 7 1 400 700 12.5 1.5 5.569 141.889 0.353 4.615 8 1 400 500 15.5 0.5 3.205 115.872 0.275 7.500 9 1 200 600 14.0 1.0 3.912 125.947 0.200 5.769 10 1 000 700 15.5 1.5 3.495 120.840 0.037 4.983 11 1 400 700 15.5 0.5 4.085 127.829 0.220 4.451 12 1 000 500 15.5 1.5 2.950 111.723 0.063 6.383 13 1 200 600 14.0 1.0 3.575 123.448 0.212 5.085 14 1 000 700 12.5 1.5 4.555 132.588 0.091 4.110 15 1 000 700 12.5 0.5 4.149 128.524 0.094 5.263 16 1 200 600 14.0 1.0 3.912 125.947 0.200 5.769 17 1 000 700 15.5 0.5 3.073 114.183 0.039 5.357 18 1 400 500 12.5 0.5 3.573 121.529 0.316 5.488 19 1 000 500 12.5 0.5 2.579 104.422 0.095 5.769 20 1 400 700 15.5 1.5 4.124 128.552 0.264 5.625
下载: 导出CSV
表 3 方差分析结果
Table 3 Results of ANOVA
宽高比 λ p 值 接触角 θ p 值 稀释率 κ p 值 晶粒平均截距 l p 值 模型 0 模型 0 模型 0 模型 0 P 0 P 0 P 0 P 0.242 V 0 V 0 Q 0 V 0 Q 0 Q 0 — — Q 0 D 0 D 0 — — D 0.048 VQ 0 VD 0.048 — — PD 0.019 VD 0.045 — — — — VQ 0.006 QD 0.020 — — — — — — R2 = 0.980 Adj. R2 = 0.969 R2 = 0.938 Adj. R2 = 0.916 R2 = 0.968 Adj. R2 = 0.965 R2 = 0.856 Adj. R2 = 0.789 — Pred. R2 = 0.943 — Pred. R2 = 0.856 — Pred. R2 = 0.955 — Pred. R2 = 0.636
下载: 导出CSV
表 4 规范化的各响应回归系数
Table 4 Normalized regression coefficients for responses
回归系数对应变量 激光功率P* 扫描速度V* 送粉量Q* 粉离焦量D* 扫描速度送粉量V*Q* 扫描速度粉离焦量V*D* 送粉量粉离焦量Q*D* 激光功率粉离焦量P*D* 宽高比 λ 0.397 0.479 −0.388 0.263 −0.163 −0.073 −0.087 — 接触角 θ 5.295 6.200 −4.541 3.856 — −1.526 — — 稀释率 κ 0.110 — −0.036 — — — — — 晶粒平均截距 l 0.137 −0.614 0.533 −0.244 −0.365 — — 0.300
下载: 导出CSV
表 5 优化结果和试验
Table 5 Optimization results and validation experiment
激光功率P/W 扫描速度v /(mm·min−1) 送粉量Q/(g·min−1) 粉离焦量D/mm 宽高比λ 接触角θ/(°) 稀释率κ(%) 晶粒平均截距l/μm 合意性 结果 预测值 1 400.00 503.13 12.50 0.50 3.50 121.26 0.34 5.31 0.79 优化 1 350.00 550.00 12.50 0.50 3.74 123.55 0.31 5.23 0.53 — 1 350.00 516.92 12.50 0.50 3.49 121.00 0.31 5.31 0.56 — 1 400.00 500.00 12.50 0.50 4.00 124.70 0.31 5.57 — — 误差δ(%) — — — — 12.50 2.76 9.68 4.67 — —
下载: 导出CSV
-
[1] 刘伟, 李能, 周标, 等. 复杂结构与高性能材料增材制造技术进展[J]. 机械工程学报, 2019, 55(20): 128 − 151. Liu Wei, Li Neng, Zhou Biao, et al. Progress in additive manufacturing on complex structures and high-performance materials[J]. Journal of Mechanical Engineering, 2019, 55(20): 128 − 151.
[2] 刘立君, 刘大宇, 王晓陆, 等. H13钢激光熔覆陶瓷修复层的参数优化[J]. 焊接学报, 2020, 41(7): 65 − 70. doi: 10.12073/j.hjxb.20200508002 Liu Lijun, Liu Dayu, Wang Xiaolu, et al. Parameter optimization of laser cladding ceramic repair layer of H13 steel[J]. Transactions of the China Welding Institution, 2020, 41(7): 65 − 70. doi: 10.12073/j.hjxb.20200508002
[3] Gao J, Wu C, Hao Y, et al. Numerical simulation and experimental investigation on three-dimensional modelling of single-track geometry and temperature evolution by laser cladding[J]. Optics & Laser Technology, 2020, 129: 106287 − 106298.
[4] Gao S, Feng Y, Wang J, et al. Molten pool characteristics of a nickel-titanium shape memory alloy for directed energy deposition[J]. Optics & Laser Technology, 2021, 142: 107215 − 107228.
[5] Huang Y, Khamesee M B, Toyserkani E. A comprehensive analytical model for laser powder-fed additive manufacturing[J]. Additive Manufacturing, 2016, 12(partA): 90 − 99.
[6] Ertay D S, Vlasea M, Erkorkmaz K. Thermomechanical and geometry model for directed energy deposition with 2d/3d toolpaths[J]. Additive Manufacturing, 2020, 35: 1 − 42.
[7] Ansari M, Shoja Razavi R, Barekat M. An empirical-statistical model for coaxial laser cladding of NiCrAlY powder on Inconel 738 superalloy[J]. Optics & Laser Technology, 2016, 86: 136 − 144.
[8] Erfanmanesh M, Abdollah-Pour H, Mohammadian-Semnani H, et al. An empirical-statistical model for laser cladding of WC-12Co powder on AISI 321 stainless steel[J]. Optics & Laser Technology, 2017, 97: 180 − 186.
[9] Nabhani M, Razavi R S, Barekat M. An empirical-statistical model for laser cladding of Ti-6Al-4V powder on Ti-6Al-4V substrate[J]. Optics & Laser Technology, 2018, 100: 265 − 271.
[10] Wen P, Feng Z, Zheng S. Formation quality optimization of laser hot wire cladding for repairing martensite precipitation hardening stainless steel[J]. Optics & Laser Technology, 2015, 65: 180 − 188.
[11] Sun Y, Hao M. Statistical analysis and optimization of process parameters in Ti6Al4V laser cladding using Nd: YAG laser[J]. Optics and Lasers in Engineering, 2012, 50(7): 985 − 995. doi: 10.1016/j.optlaseng.2012.01.018
[12] Alam M K, Urbanic R J, Nazemi N, et al. Predictive modeling and the effect of process parameters on the hardness and bead characteristics for laser-cladded stainless steel[J]. The International Journal of Advanced Manufacturing Technology, 2018, 94(1): 397 − 413.
[13] Zhang Hui, Zou Yong, Zou Zengda, et al. Comparative study on continuous and pulsed wave fiber laser cladding in-situ titanium-vanadium carbides reinforced Fe-based composite layer[J]. Materials Letters, 2015, 139: 255 − 257. doi: 10.1016/j.matlet.2014.10.102
[14] Li Ruidi, Yuan Tiechui, Qiua Zili, et al. Nanostructured Co-Cr-Fe alloy surface layer fabricated by combination of laser clad and friction stir processing[J]. Surface & Coatings Technology, 2014, 258: 412 − 425.
[15] Xie S, Li R, Yuan T, et al. Laser cladding assisted by friction stir processing for preparation of deformed crack-free Ni-Cr-Fe coating with nanostructure[J]. Optics Laser Technology, 2018, 337: 426 − 433.
[16] Montero-Sistiaga Maria L, Godino-Martinez Miguel, Boschmans Kurt, et al. Microstructure evolution of 316L produced by HP-SLM (high power selective laser melting)[J]. Additive Manufacturing, 2018, 23: 402 − 410. doi: 10.1016/j.addma.2018.08.028
[17] Zhang Z, Farahmand P, Kovacevic R. Laser cladding of 420 stainless steel with molybdenum on mild steel A36 by a high power direct diode laser[J]. Materials & Design, 2016, 109: 686 − 699.
[18] Zhang D, Qiu D, Gibson M A, et al. Additive manufacturing of ultrafine-grained high-strength titanium alloys[J]. Nature, 2019, 576(7785): 91 − 95. doi: 10.1038/s41586-019-1783-1
[19] Alali M, Todd I, Wynne B P. Through-thickness microstructure and mechanical properties of electron beam welded 20 mm thick AISI 316L austenitic stainless steel[J]. Materials & Design, 2017, 130: 488 − 500.
[20] Erinosho M F, Akinlabi E T. Central composite design on the volume of laser metal deposited Ti6Al4V and Cu[J]. Materiali in Tehnologije, 2017, 51(3): 419 − 426. doi: 10.17222/mit.2016.019
[21] Ma Pengzhao, Wu Yu, Zhang Pengju, et al. Solidification prediction of laser cladding 316L by the finite element simulation[J]. The International Journal of Advanced Manufacturing Technology, 2019, 103(1): 957 − 969.
[22] Wang L, Xue J, Wang Q. Correlation between arc mode, microstructure, and mechanical properties during wire arc additive manufacturing of 316L stainless steel[J]. Materials Science & Engineering, 2019, 751(28): 183 − 190.
-
期刊类型引用(6)
1. 刘金浩,李家辰,张亮亮,吴宝生,李鹏,董红刚. Al-Mg合金搅拌摩擦焊接头的组织演变及腐蚀性能. 机械制造文摘(焊接分册). 2025(02): 13-22+36 .  百度学术
百度学术
2. 金聪聪,黄立兵,黄文彬,王大力,马月婷,李鹏,董红刚. 新型铝合金MIG焊接头微观组织与力学性能. 焊接学报. 2024(07): 74-82 . 本站查看
3. 薛新莲,臧华平,王洪建,李顺方. 铝合金板激光切割实验工艺研究. 激光杂志. 2024(09): 183-187 . 百度学术
4. 陈晓,闫成旗,代俊辉. 基于IRSM的7075铝合金焊接接头抗拉强度可靠性优化设计. 焊接. 2024(10): 32-41 . 百度学术
5. 刘金浩,李家辰,张亮亮,吴宝生,李鹏,董红刚. Al-Mg合金搅拌摩擦焊接头的组织演变及腐蚀性能. 焊接学报. 2024(10): 8-18 . 本站查看
6. 邓伟,罗坤,雷基林,宋仲模,徐远志,张勇. 基于灰色关联性分析的铝合金缸体铸造工艺参数优化. 特种铸造及有色合金. 2024(11): 1511-1517 . 百度学术
其他类型引用(6)


计量
- 文章访问数: 284
- HTML全文浏览量: 69
- PDF下载量: 71
- 被引次数: 12
