
Online prediction of resistance spot weld quality and model explanation under fluctuating conditions
-
摘要: 基于电阻点焊过程的多传感信号特征,面向多种板材组合建立焊点质量在线预测模型,研究了异常工况波动对四类机器学习回归模型的影响,分析了不同模型和输入变量对含异常工况试验数据集的适应性,并采用Shapley值、t-SNE等方法对波动工况下的模型性能进行解释.结果表明,高斯过程回归模型和电阻 + 力信号具有最佳的熔核直径预测性能,焊接电流、热输入能量和电极位移峰值特征对于波动工况具有良好普适性.此外,异常工况引起的信号特征分布差异会显著影响回归预测模型的泛化性能,应尽量减少训练集与数据集差异以提高焊点质量预测的准确性.Abstract: Based on the features of multi-sensing signals in resistance spot welding process, online prediction models were established for the spot weld quality of different stack-ups in this paper. The influence of fluctuating welding conditions fluctuation on four machine learning regression models was studied, and the adaptability of different models and input variables on the database containing data of abnormal conditions was analyzed. Shapley value, and t-SNE methods were used to explain the model performance under fluctuating conditions. The results show that the Gaussian process regression model and resistance + force signal input had the best prediction performance of nugget diameter. Features of welding current, heat input and peak value of electrode displacement had good universality under fluctuating conditions. Besides, the difference of feature distribution caused by condition fluctuation could significantly influence the generalization performance of regression models. Thereby, the reduction of the difference between training set and test set could improve the prediction accuracy.
-
-
![]()
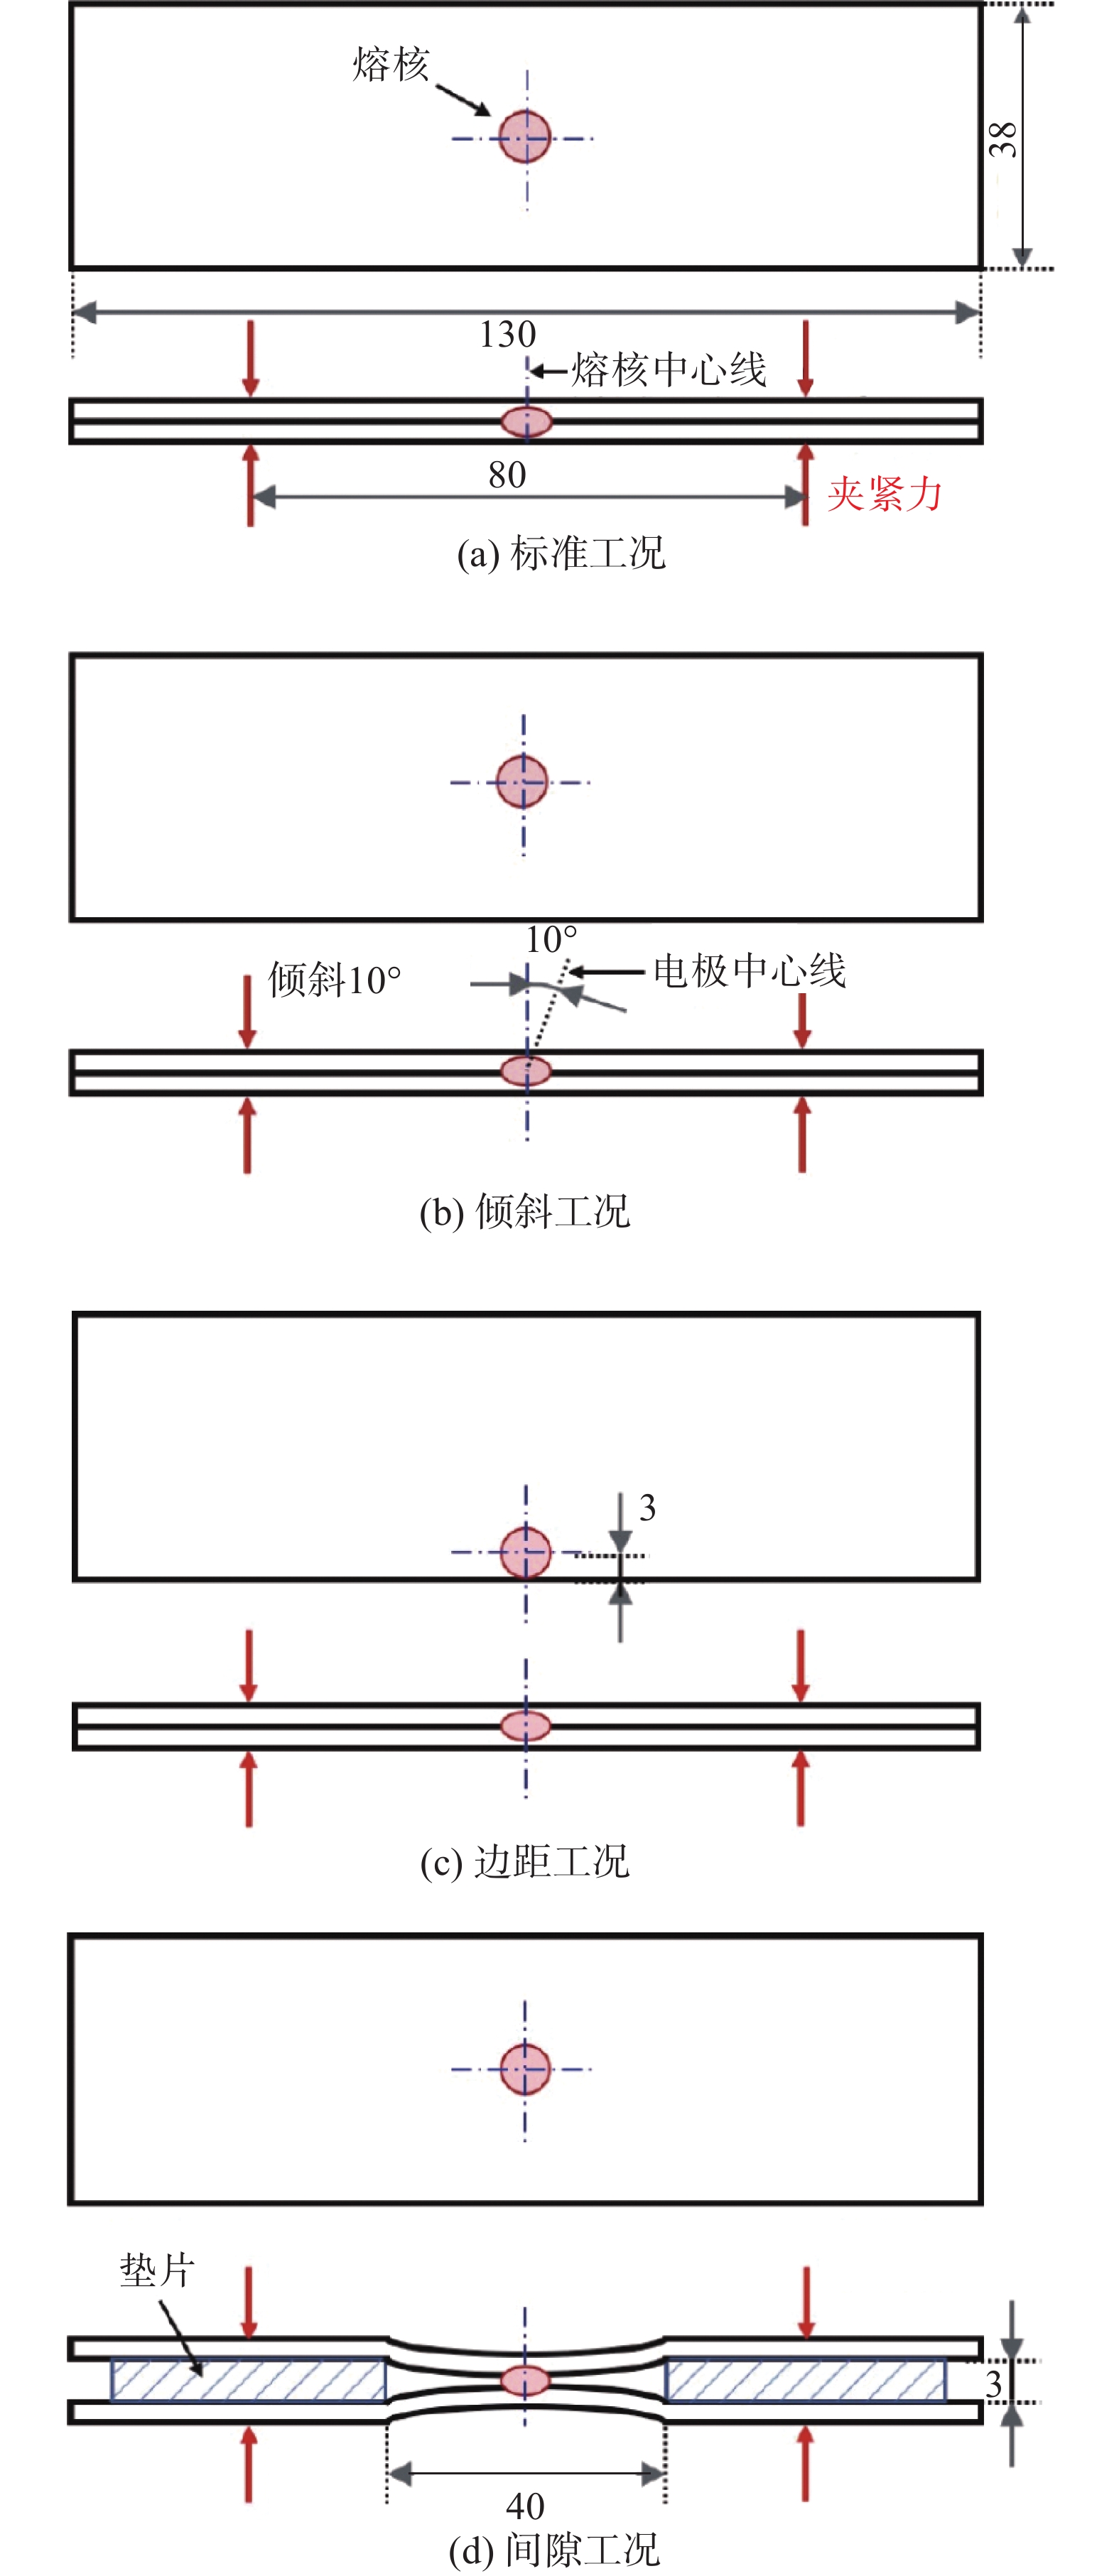
图 1 标准、倾斜、边距和间隙工况的试样尺寸及设置方法示意图(mm)
Figure 1. Schematics of the specimens and setup methods of standard, electrode angle, edge proximity and initial gap conditions (mm). (a) standard condition; (b) electrode angle condition; (c) edge proximity condition; (d) initial gap condition
![]()
图 5 过程信号特征提取示意图
Figure 5. Schematics of feature extraction methods of dynamic resistance, electrode force and electrode displacement signals. (a) dynamic resistance features; (b)electrode force features; (c) electrode displacement features
![]()
图 6 不同机器学习回归模型的预测—实测值
Figure 6. Prediction-response results of different machine learning regression models. (a) multiple linear regression; (b) Gaussian process regression; (c) support vector regression; (d) multilayer perceptron regression
![]()
图 7 输入特征值对GPR模型的Shapley值分布
Figure 7. Shapley value distribution of input features on GPR models. (a) model trained on ST dataset; (b) model trained on ALL dataset
![]()
图 8 GPR模型泛化性测试的预测—实测值
Figure 8. Prediction-response results of GPR model generalization test. (a) training result in ST dataset; (b) training result in ALL-ST dataset
表 1 DP590和BUFD的化学成分(质量分数, %)
Table 1 The chemical components of DP590 and BUFD
材料 C Si Mn P S 其它 Fe DP590 0.055 0.507 1.616 0.010 0.004 0.048 余量 BUFD 0.002 — 0.012 0.003 0.006 0.030 余量  下载: 导出CSV
表 2 DP590和BUFD的力学性能
Table 2 The mechanical properties of DP590 and BUFD
材料 屈服强度ReL/MPa 抗拉强度Rm/MPa 断后伸长率A(%) DP590 357 627 24.9 BUFD 162 288 49.0
下载: 导出CSV
表 3 焊接方案设计
Table 3 Welding schedule design.
序号 上板 下板 焊接电流
I/kA电极力
F/kN焊接时间t/ms 1 0.8 mm厚 DP590 0.8 mm厚 DP590 5 ~ 10 2.6 ~ 3.6 100 ~ 200 2 0.8 mm厚 BUFD 1.6 mm厚 BUFD 5 ~ 10 2.6 ~ 3.6 100 ~ 200 3 0.8 mm厚 DP590 1.6 mm厚 BUFD 5 ~ 10 2.6 ~ 3.6 100 ~ 200 4 1.6 mm厚 BUFD 1.6 mm厚 DP590 5 ~ 10 2.6 ~ 3.6 100 ~ 200
下载: 导出CSV
表 4 线性回归模型的预测性能对比
Table 4 Performance comparison of multiple linear regression models.
模型 A±1 mm (%) RMSE/mm 标准 MLR 86.82 0.695 含交互项 MLR 11.75 35.657 稳健性 MLR 85.67 0.728 逐步 MLR 89.68 0.665
下载: 导出CSV
表 5 高斯过程回归模型的预测性能对比
Table 5 Performance comparison of Gaussian process regression models.
模型 A±1 mm (%) RMSE/mm 二次有理GPR 90.54 0.600 指数GPR 91.12 0.571 平方指数GPR 90.54 0.905 可优化GPR 91.12 0.570
下载: 导出CSV
表 6 支持向量回归模型的预测性能对比
Table 6 Performance comparison of support vector regression models.
模型 A±1 mm (%) RMSE/mm 线性SVR 86.53 0.696 多项式SVR 二次 89.40 0.676 三次 83.09 0.831 高斯SVR 粗略 86.25 0.725 中等 89.40 0.637 精细 75.07 0.966 可优化SVR 87.96 0.659 混合核函数SVR 87.11 0.761
下载: 导出CSV
表 7 神经网络回归模型的预测性能对比
Table 7 Performance comparison of multilayer perceptron regression models.
模型 A±1 mm (%) RMSE/mm MLP 节点数 单层MLP 10节点 81.95 0.907 50节点 83.89 0.875 150节点 86.24 0.768 10节点 83.67 0.828 双层MLP 50节点 83.95 0.818 150节点 85.57 0.765 10节点 82.23 0.876 50节点 85.96 0.777 三层MLP 150节点 86.25 0.728 500节点 88.25 0.713 1000节点 87.38 0.749 ResNet-MLP 150节点 17.23 3.151 500节点 87.39 0.736
下载: 导出CSV
表 8 优化后回归模型的预测性能及稳定性
Table 8 Prediction performance and stability of optimized regression models.
模型 A±1 mm (%) RMSE/mm MLR 86.61 ± 1.13 0.777 ± 0.038 GPR 90.13 ± 0.51 0.614 ± 0.023 SVR 88.08 ± 0.67 0.671 ± 0.014 MLP 87.45 ± 0.90 0.743 ± 0.037
下载: 导出CSV
表 9 不同信号特征输入下GPR模型的预测性能
Table 9 Prediction performance of GPR models with different input signals.
输入信号 训练集 A±1 mm (%) RMSE/mm 工艺参数 ST 88.30 ± 2.12 0.706 ± 0.045 ALL 76.68 ± 0.84 0.951 ± 0.010 电阻 ST 92.71 ± 1.95 0.604 ± 0.036 ALL 85.80 ± 2.68 0.729 ± 0.040 电极力 ST 90.11 ± 3.90 0.660 ± 0.173 ALL 85.27 ± 2.01 0.751 ± 0.027 位移 ST 94.01 ± 2.60 0.635 ± 0.035 ALL 88.56 ± 0.84 0.716 ± 0.029 电阻 + 电极力 ST 92.06 ± 3.90 0.607 ± 0.054 ALL 91.24 ± 1.51 0.601 ± 0.026 电阻 + 位移 ST 90.32 ± 3.90 0.657 ± 0.135 ALL 89.26 ± 2.18 0.628 ± 0.055 电极力 + 位移 ST 93.23 ± 3.25 0.628 ± 0.060 ALL 88.32 ± 1.68 0.683 ± 0.057
下载: 导出CSV
表 10 GPR模型对波动工况的泛化性测试
Table 10 Generalization test of GPR model on welding condition fluctuation.
训练集工况 A±1 mm (%) RMSE/
mm测试集工况 A±1 mm (%) RMSE/
mm标准 94.10 0.567 倾斜 + 边距 + 间隙 79.18 0.833 标准 + 倾斜 + 边距 92.24 0.590 间隙 92.39 0.581 标准 + 倾斜 + 间隙 88.89 0.585 边距 51.21 1.361 标准 + 边距 + 间隙 91.60 0.583 倾斜 69.99 1.045
下载: 导出CSV
-
[1] 王敏. 电阻焊在汽车工业中的应用[J]. 电焊机, 2003, 33(1): 1 − 6. Wang Min. Application of resistance welding in automotive industry[J]. Electric Welding Machine, 2003, 33(1): 1 − 6.
[2] Cho Y, Li W, Hu S J. Design of experiment analysis and weld lobe estimation for aluminum resistance spot welding[J]. Welding Journal, 2006, 85(3): 45s − 51s.
[3] 中国机械工程学会焊接学会电阻焊专业委员会(III). 电阻焊理论与实践[M]. 北京: 机械工业出版社, 1994. Professional Committee of Resistance Welding (III) of Welding Society of China Mechanical Engineering Society. Theory and Practice of Resistance Welding[M]. Beijing: China Machinery Industry Press, 1994.
[4] 夏裕俊, 李永兵, 楼铭, 等. 电阻点焊质量监控技术研究进展与分析[J]. 中国机械工程, 2020, 31(1): 100 − 125. doi: 10.3969/j.issn.1004-132X.2020.01.011 Xia Yujun, Li Yongbin, Lou Ming, et al. Recent advances and analysis of quality monitoring and control technologies for RSW[J]. China Mechanical Engineering, 2020, 31(1): 100 − 125. doi: 10.3969/j.issn.1004-132X.2020.01.011
[5] Dickinson D W, Franklin J E, Stanya A. Characterization of spot welding behavior by dynamic electrical parameter monitoring[J]. Welding Journal, 1980, 59(6): 170s − 176s.
[6] Chang H S, Kwon H C. In-process monitoring of micro resistance spot weld quality using accelerometer[J]. Korea Journal of Welding and Joining, 2011, 29(1): 115 − 122. doi: 10.5781/KWJS.2011.29.1.115
[7] Zhang H Y, Hu J S. Resistance welding: Fundamentals and applications[M]. London: CRC Press, 2011.
[8] Chen G, Sheng B, Luo R, et al. A parallel strategy for predicting the quality of welded joints in automotive bodies based on machine learning[J]. Journal of Manufacturing Systems, 2022, 62: 636 − 649. doi: 10.1016/j.jmsy.2022.01.011
[9] Gavidel S Z, Lu S, Rickli J. Performance analysis and comparison of machine learning algorithms for predicting nugget width of resistance spot welding joints[J]. The International Journal of Advanced Manufacturing Technology, 2019, 105: 3779 − 3796. doi: 10.1007/s00170-019-03821-z
[10] Zhao D, Bezgans Y, Wang Y, et al. Performances of dimension reduction techniques for welding quality prediction based on the dynamic resistance signal[J]. Journal of Manufacturing Processes, 2020, 58: 335 − 343. doi: 10.1016/j.jmapro.2020.08.037
[11] El-Sari B, Biegler M, Rethmeier M. Investigation of the extrapolation capability of an artificial neural network algorithm in combination with process signals in resistance spot welding of advanced high-strength steels[J]. Metals, 2021, 11(11): 1874. doi: 10.3390/met11111874
[12] Zhou B F, Pychynski T, Reischl M, et al. Comparison of machine learning approaches for time-series-based quality monitoring of resistance spot welding[J]. Archives of Data Science: Series A, 2018, 5(1): 1 − 17.
[13] Xia Y J, Su Z W, Li Y B, et al. Online quantitative evaluation of expulsion in resistance spot welding[J]. Journal of Manufacturing Processes, 2019, 46(10): 34 − 43.
[14] American welding society. Specification for automotive weld quality-resistance spot welding of steel[S]. AWS/ANSI Standard AWS D8.1M, 2013.
[15] Zhao D W, Wang Y X, Liang D J. Correlating variations in the dynamic power signature to nugget diameter in resistance spot welding using Kriging model[J]. Measurement, 2019, 135: 6 − 12. doi: 10.1016/j.measurement.2018.11.025
[16] Simončič S, Podržaj P. Resistance spot weld strength estimation based on electrode tip displacement/velocity curve obtained by image processing[J]. Science & Technology of Welding & Joining, 2014, 19(6): 468 − 475.
[17] Wang L, Hou Y, Zhang H, et al. A new measurement method for the dynamic resistance signal during the resistance spot welding process[J]. Measurement Science and Technology, 2016, 27(9): 095009. doi: 10.1088/0957-0233/27/9/095009
[18] Min J. Real time monitoring weld quality of resistance spot welding for the fabrication of sheet metal assemblies[J]. Journal of Materials Processing Technology, 2003, 132: 102 − 113. doi: 10.1016/S0924-0136(02)00409-0
[19] Lee J, Noh I, Jeong S I, et al. Development of real-time diagnosis framework for angular misalignment of robot spot-welding system based on machine learning[J]. Procedia Manufacturing, 2020, 48: 1009 − 1019. doi: 10.1016/j.promfg.2020.05.140
[20] Zhou L, Xia Y J, Shen Y, et al. Comparative study on resistance and displacement based adaptive output tracking control strategies for resistance spot welding[J]. Journal of Manufacturing Processes, 2021, 63(3): 98 − 108.
-
期刊类型引用(5)
1. 王通,孟惠民,葛鹏飞,李全德,巩秀芳,倪荣,姜英,龚显龙,戴君,隆彬. 2Cr-1Ni-1.2Mo-0.2V钢在NH_4H_2PO_4溶液中的电化学腐蚀行为研究. 中国腐蚀与防护学报. 2022(04): 551-562 .  百度学术
百度学术
2. 苍雨,黄毓晖,翁硕,轩福贞. 环境变量对核电汽轮机转子钢焊接接头电偶腐蚀性能的影响. 中国腐蚀与防护学报. 2021(03): 318-326 . 百度学术
3. 黄毓晖,张建辉,胡语林,孙雯暄,徐宇斌,汪毅豪. 核电汽轮机转子堆焊焊接接头的电偶腐蚀行为及有限元仿真. 焊接学报. 2021(08): 33-39+99 . 本站查看
4. 陈君,康凯,冯钜,熊长奇,曹丹,尹杰. 压水堆核电站结构材料的腐蚀行为研究进展. 西华大学学报(自然科学版). 2020(03): 104-112 . 百度学术
5. 黄毓晖,司晓法,翁硕,轩福贞. 疲劳损伤对核电汽轮机焊接转子接头应力腐蚀开裂敏感性的影响. 焊接学报. 2020(04): 12-19+37+97-98 . 本站查看
其他类型引用(3)


计量
- 文章访问数: 369
- HTML全文浏览量: 86
- PDF下载量: 63
- 被引次数: 8
